Brunei R User Group’s first event delved into spatial analysis with R, marking an exciting start for the community.
After-Event Summary: Exploration of Spatial Data Insights with R
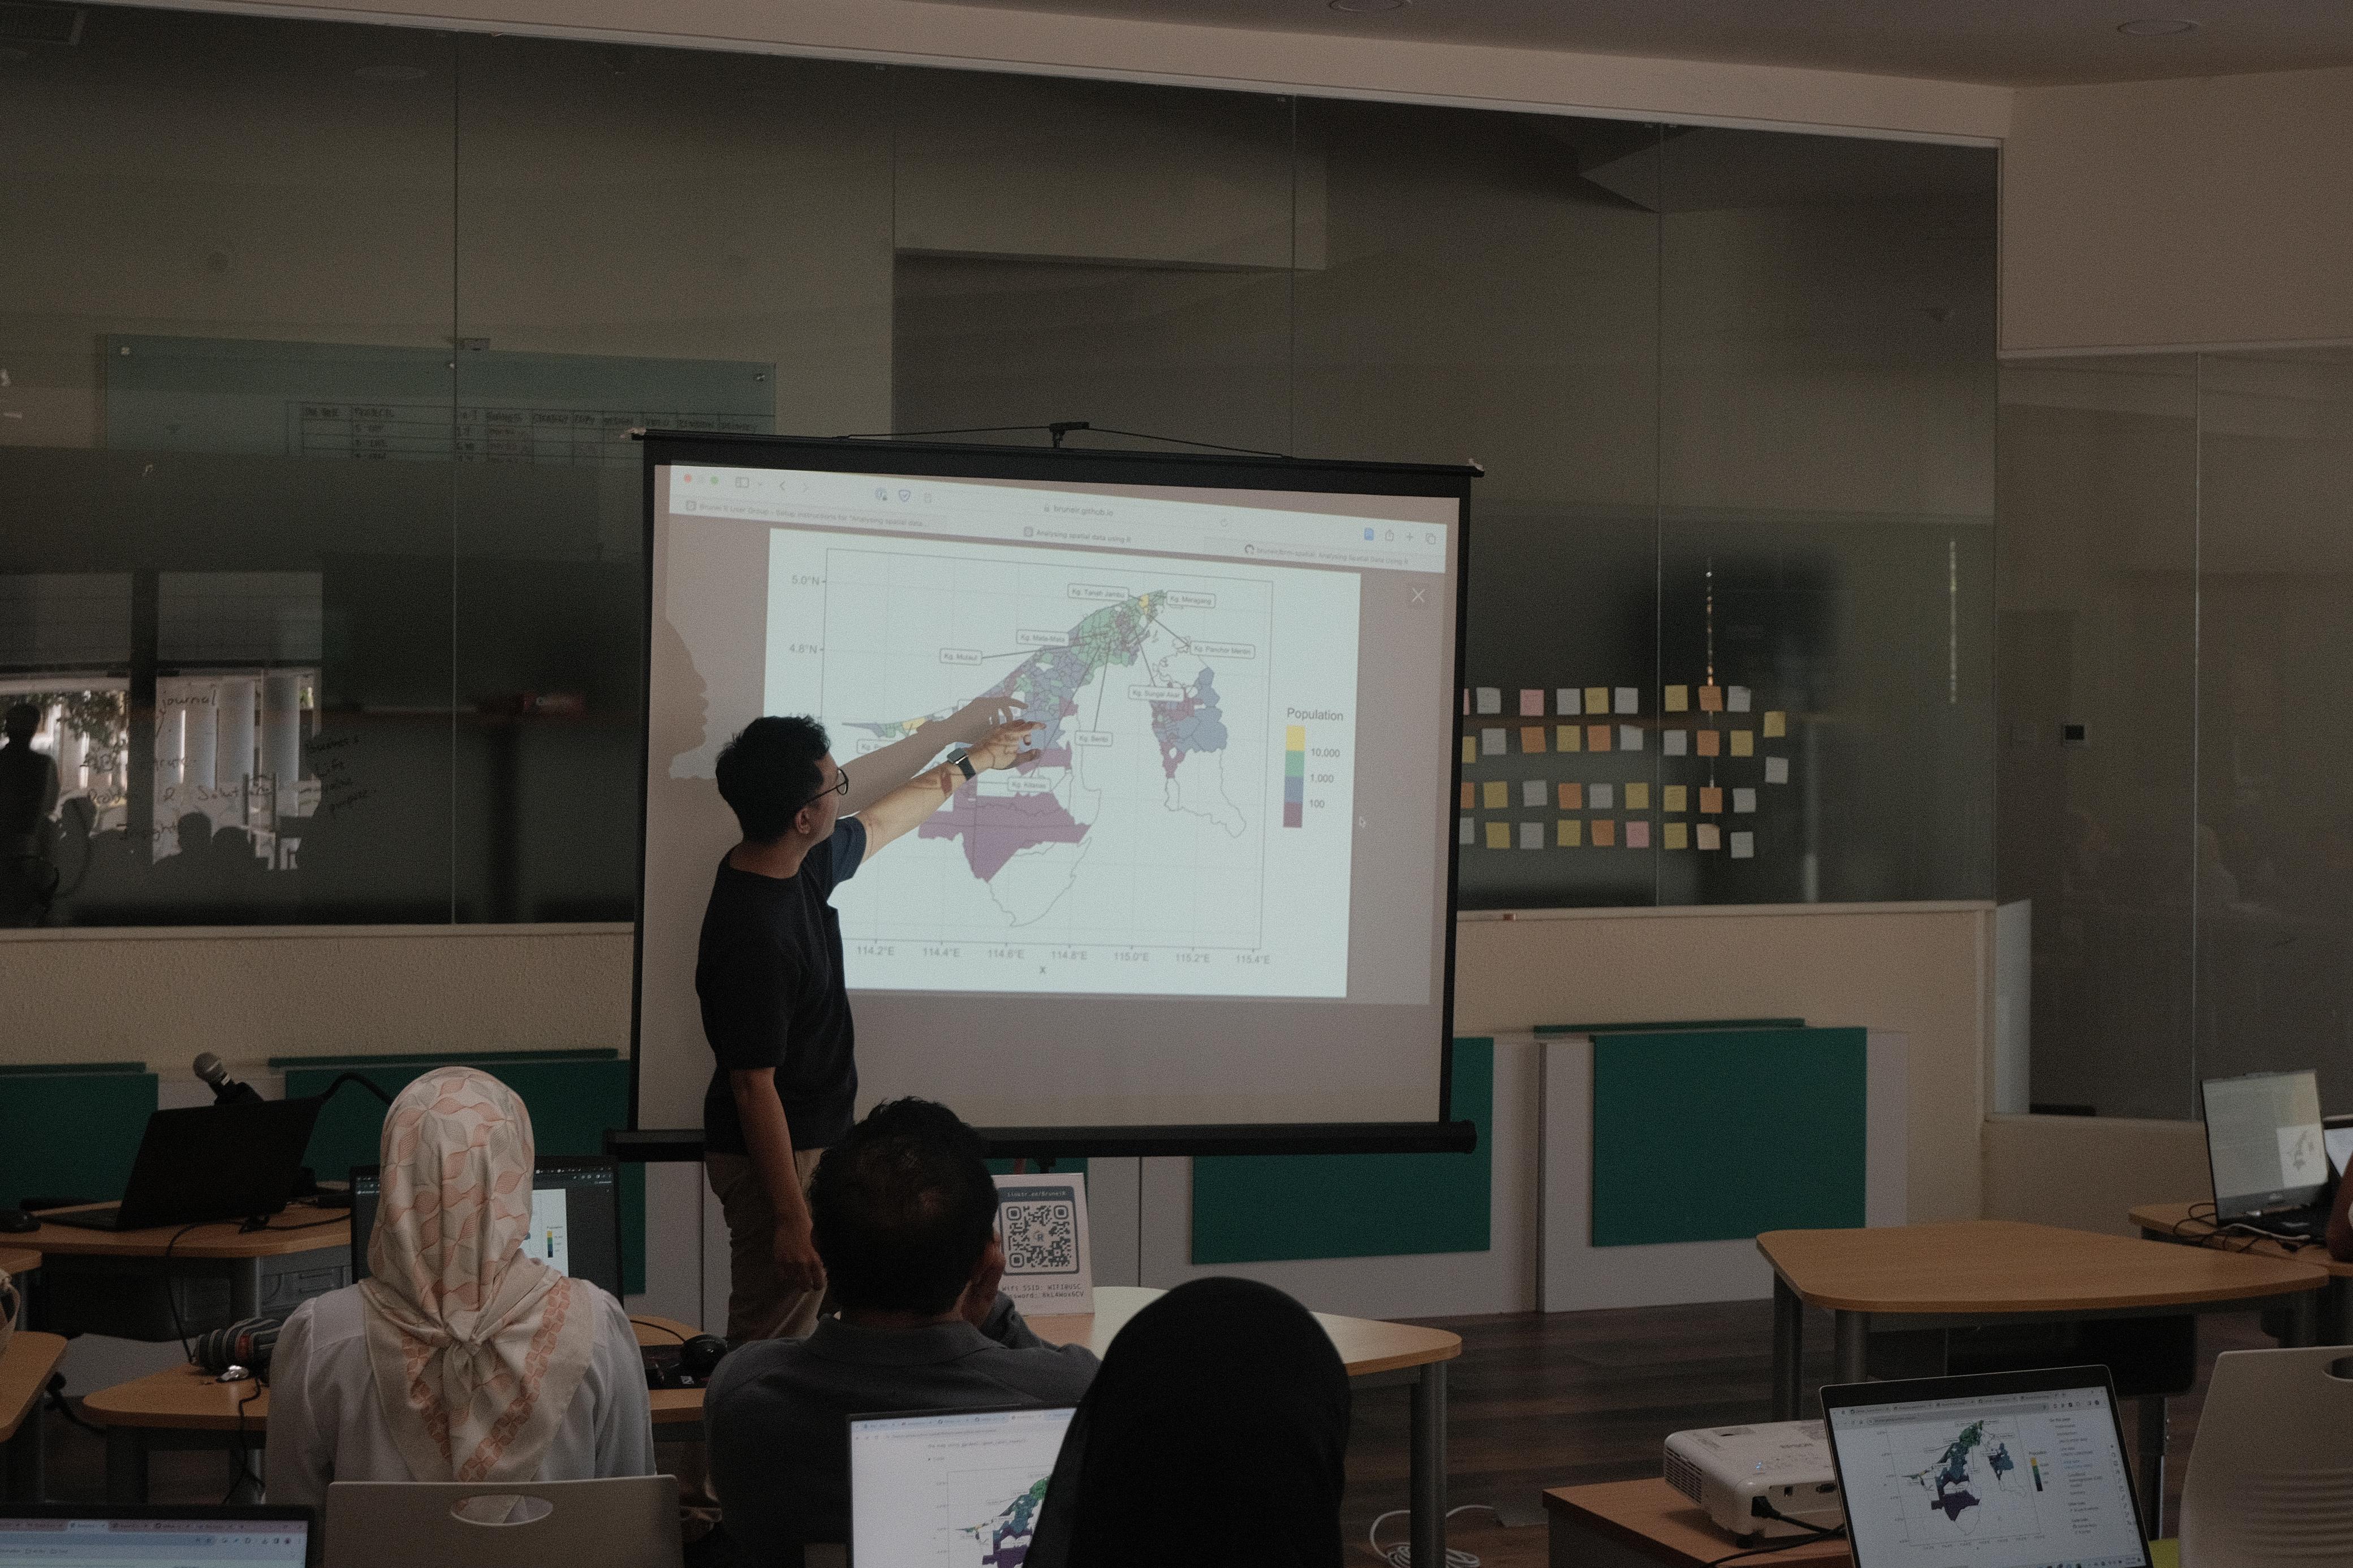
We’re excited to share the key takeaways from our inaugural event, “Analysing Spatial Data using R,” held on March 9, 2024. Led by Dr. Haziq Jamil, Assistant Professor in Statistics at UBD, this event highlighted Geographical Information Systems (GIS) data analysis with R. Let’s delve into the highlights:
Unveiling Spatial Data Fundamentals
Attendees were guided through a comprehensive exploration of spatial data fundamentals, starting with the basics of importing various spatial data formats. Dr. Haziq elucidated the process of harnessing R’s capabilities to manipulate and visualize spatial data, paving the way for attendees to uncover valuable insights hidden within geographical datasets.
Integrating Spatial Analysis Techniques
One of the highlights of the event was the integration of spatial analysis techniques with real-world datasets. Participants learned how to combine spatial data with other types of study data, such as house price data modeling and disease outbreak mapping, demonstrating the versatility and applicability of spatial analysis across diverse domains.
Hands-On Learning Experience

The event was not just about theoretical concepts; it provided attendees with a hands-on learning experience through interactive coding exercises. Participants had the opportunity to follow along and apply their newfound knowledge in real-time, reinforcing their understanding of spatial data analysis techniques.
Who Benefited from the Event?
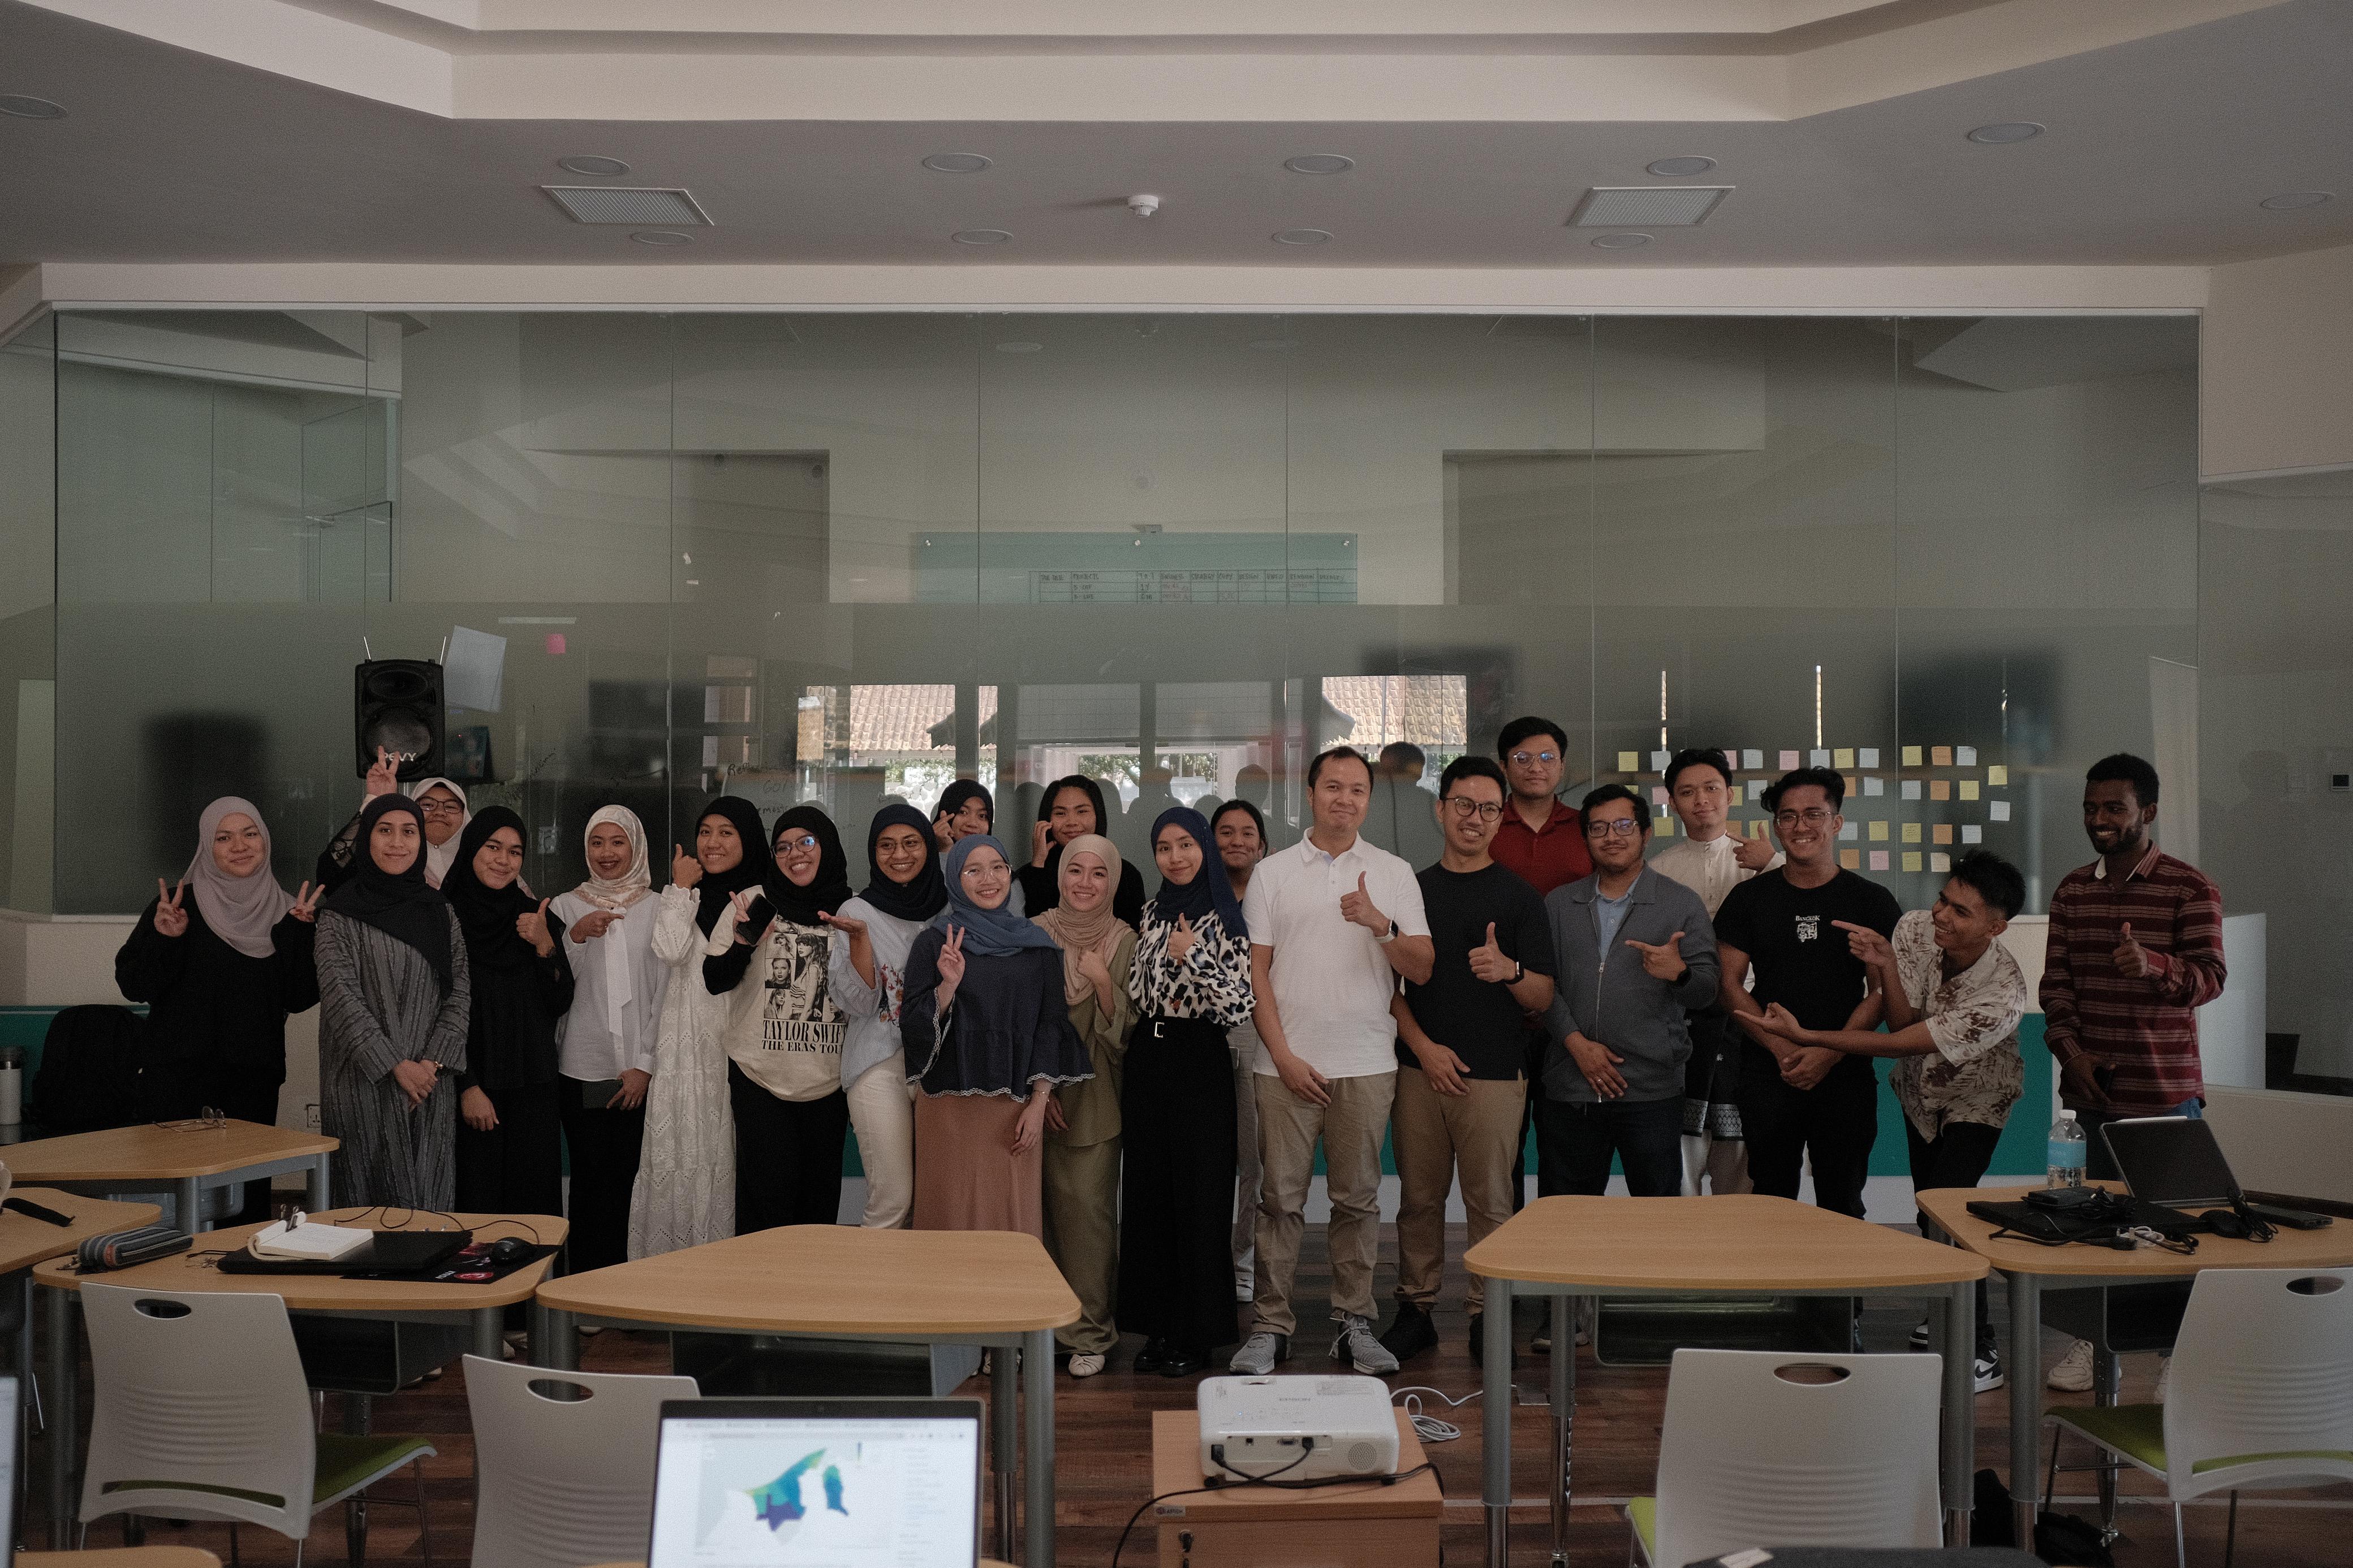
The event catered to a wide audience, from beginners to seasoned R users, as well as researchers and students eager to incorporate spatial analysis into their work. Regardless of their level of expertise, attendees found valuable insights and practical skills that they could apply to their projects and research endeavors.
Empowering Spatial Data Exploration
Brunei R User Group provided a dynamic platform for attendees to broaden their skills and delve into the realm of spatial data analysis. Through captivating presentations, hands-on exercises, and enriching discussions, participants departed the event with newfound proficiency and confidence in harnessing the power of spatial data.
Join the Spatial Data Revolution
Missed out on the event? Don’t worry! Stay tuned for future opportunities to explore the dynamic world of spatial data analysis with R. Whether you’re a novice or an expert, there’s always something new to discover and learn in the ever-evolving landscape of data science. Keep exploring, keep innovating, and let R be your guide in unraveling the mysteries of spatial data.
Happy Coding,
The Brunei R User Group.